Saturday, February 26, 2011

Static Maps vs Tile Layers

Another interesting feature of XC Skies V3 is the ability to view any size XC Skies forecast parameter from the Map as a static image. This eliminates the need to load files to a browser for creating the dynamic map features. So usage of static XC Skies Maps is a two fold win! For example, the below screen shot contains 574KB of tile images.

Resized image (not to scale)

The same image as a static map is only 120KB with a quality of 70 (see last post). Static maps will replace the old QuickLooks images and allow for mobile application development once the XC Skies Image API is released to those interested in creating applications for mobile devices or their own mash-ups.


Resized image (not to scale)

Image Quality vs Size: Download Wait Time

When creating images for the web (or any application for that matter) it is always important to consider the quality of images compared to the intended purpose. For example, why bother loading a high quality thumbnail when the it can be displayed as low, or very low?

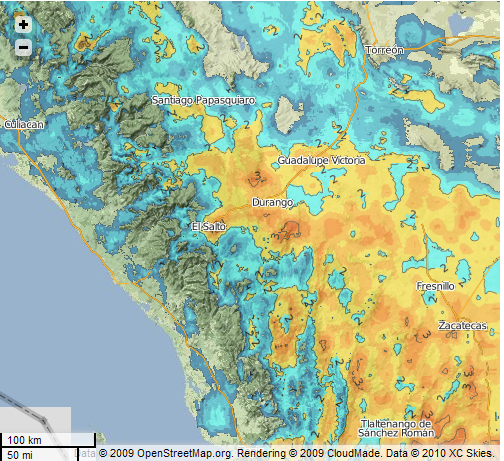
Because XC Skies is heavily image based, we are extremely sensitive to how to balance readable imagery on the threshold of smallest size. Consider this panel of collapsed tile images. Each image is composed of these layers in order: terrain base layer, contour of height above ground parameter, and a road overlay.

Click on Image to enlarge

Images with varying degrees of shading are best represented as JPEG images. Simple images with discrete colors (such as the road overlay or simple XC Skies parameter overlays) are best viewed in PNG or GIF image formats. The size of an image varies significantly depending on its content. A quick visual review of the above panel shows the same collapsed image tile as a JPEG from highest quality of 100 to very low of 10. File sizes range from 70KB to 3KB (kilobytes).

What's important is to note that between qualities of 100 and 80, the image is nearly identical in readability and sharpness of roads and labeling. The size difference is 70KB - 18KB = 52KB of unneeded image data. Depending on your needs of extracting information from the image data, you might say that a quality of 70 is acceptable, which gains an additional 4KB advantage.

Let's put this in a simple perspective.

Assume we're looking at a map with 9 tiles (each of with 256 x 256 pixel dimension size) loaded in a map frame on XC Skies. This is a viewing area of 768 x 768 pixels--plenty of room to view soaring potentials. Let's do some math.

First let's assume we're sitting at an airport hangar or competition headquarters with a wireless network with a not-so-good connection to the internet, as is almost always the case. We want to refresh the map to check the latest updates from the last model run. For this case, we'll use an effective download speed of 20KB per second (that's generous if there are 10 users on a single wireless node).

Consider these two scenarios:

Quality of image at 100: 70KB * 9 = 630KB. Download time of 31.5 seconds. After 10 seconds I'm getting annoyed...

Quality of image at 70: 14KB * 9 = 126KB. Download time of 6.3 seconds. Now that's better!

Without collapsing images, we would be downloading a total of 27 images--3 sets of 9 tiles (base terrain, XC Skies layer, and roads overlay). An average total size for 27 tile images in XC Skies Maps is around 320KB depending on the scene. Collapsing down to 9 images results in 188KB. That's a 41% decrease in images size.

More examples and usage ideas will be posted later.

Thursday, February 10, 2011

Top 100 Aviation Web Sites Stopped

A quick note: There have been issues with being part of this project / web site. We are no longer affiliating ourselves with this due to poor response times from their servers, which impact loading some of our pages and products.

Saturday, February 5, 2011

What's in the data?

It has always been annoying to me that parameter color scales and their related intervals are less than ideal for reading the XC Maps in many situations.

For example, having 1000 foot intervals for lift can be misleading and obscure what's really going on with the interaction of the terrain. So why not be able to rescale parameters on-the-fly with simple slider-bar widgets that filter out the noise? This would make for a much easier exploring tool when conditions are on the edge, or appear to be epic.

Easy to read Top of Usable Lift (TOL) with user defined contours every 250 meters.


Masking out average Thermal Index values (a new parameter) where values are only greater than 1.5 with contours applied to scaled down colors to pull out "hot spots" better. This parameter when viewed alongside updraft velocity and top of lift can help pull out regions that are more favorable to stronger thermals based on the average thermal index for each vertical profile.


Lift above ground with color intervals rescaled to show just 500 to 2400 meter heights. Also apply a mask where lift tops are less than 500m, and make those areas transparent. This allows for detailed analysis in a space where previous color scales only allowed for several color intervals. Compare with the before and after views.


Example of masking updraft velocity values less than 4 meters per second, with contours, increased color scale resolution and wind barbs at the top of lift. This map clearly shows routes of interest for gliders of high performance capacity. The detail in the new XC Skies V3 updraft velocity approaches appear to be accurately showing strong lift along ranges near the bases where sun angles favor those locations.


Interfaces are currently being developed to assist in creating modified custom layers quickly and intuitively. Users will be able to save any created layer and share it with others.

Also coming is the ability to create your own color scales, or select ones from a predefined list of useful ranges.

More exciting features to come, including the long awaited email alerts and historical flight comparisons against forecast data for matching when large scale conditions are setting up to be similar to previous flights.

Cloud Introduction

XC Skies, meet the Cloud.

Cloud, meet XC Skies.

Now go have lunch and get to know each other.

XC Skies V3 Custom Layers

For awhile we've been teasing users with the promise of some feature that would allow the slicing and dicing of soaring parameters to visually pull out the details a pilot is looking for. Being able to define a series of conditions represented in one custom layer would greatly benefit many pilots with an informative overview of the day's potential.

For example, consider asking this question and then getting a map layer that shows where the conditions are met:

Show me where the following conditions exist:

  1. The top of usable lift is at least 3,500 ft above the ground.
  2. The average wind in the boundary layer is less than 25 kph.
  3. The average thermal updraft velocity is greater than 2.5 mps.
  4. The direction of the winds at the top of usable lift are from the range of 180 degrees to 240 degrees.
  5. The surface gust is forecasted to be less than 20 kph.
Now save those conditions and call it "Ideal conditions for Steep Mountain launch". A new custom map layer is created which will be displayed on your Map session.

Pilots will also be able to create custom colors for permutations of a custom layer. These widgets will be shown in a later post.

XC Skies V3 Coming Soon

The new Version 3 of XC Skies is coming soon. Many components have been rewritten from the ground up in order to optimize old prototype code and allow for a smooth migration into the Cloud. Because of the expanded resources available by using Cloud Compute clusters, we are able to finally implement many of the features that were previously too costly in the old environment.

Over the next bit we will be showcasing some of these new features. For example, one issue with using XC Maps for many users is the slow downloads of individual map tiles, which then stack onto each other. For users with fast Internet connections this is not an issue, but when dozens of pilots are sharing a single wireless connection, this makes for a frustrating experience.

The main problem is that each tile set increases the number of image downloads by a factor of 4 depending on the data being viewed.

We are now pleased to announce Collapsible Layers. This feature will handle the image merging for you on the server side and return one set of images, compressed and optimized as best as possible. This not only decreases the download sizes, but also minimizes the amount of images 'gets' to our servers. All of this makes for a better experience and happier pilots.

Here's the idea of Collapsible Layers:

Users will now be able to select which layers to merge, in what order, and the transparency desired of each layer.

More examples and details of other development items will be shared shortly.