For example, having 1000 foot intervals for lift can be misleading and obscure what's really going on with the interaction of the terrain. So why not be able to rescale parameters on-the-fly with simple slider-bar widgets that filter out the noise? This would make for a much easier exploring tool when conditions are on the edge, or appear to be epic.
 Easy to read Top of Usable Lift (TOL) with user defined contours every 250 meters.
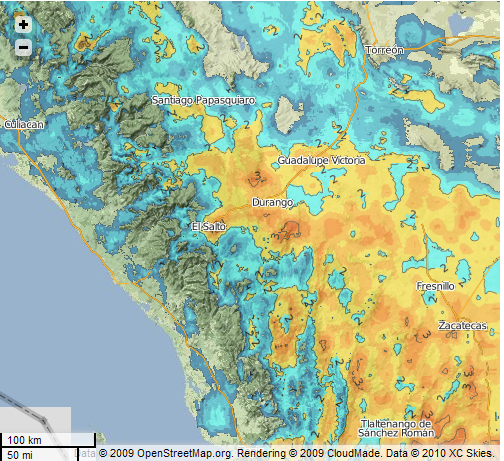 Masking out average Thermal Index values (a new parameter) where values are only greater than 1.5 with contours applied to scaled down colors to pull out "hot spots" better. This parameter when viewed alongside updraft velocity and top of lift can help pull out regions that are more favorable to stronger thermals based on the average thermal index for each vertical profile.
 Lift above ground with color intervals rescaled to show just 500 to 2400 meter heights. Also apply a mask where lift tops are less than 500m, and make those areas transparent. This allows for detailed analysis in a space where previous color scales only allowed for several color intervals. Compare with the before and after views.
 Example of masking updraft velocity values less than 4 meters per second, with contours, increased color scale resolution and wind barbs at the top of lift. This map clearly shows routes of interest for gliders of high performance capacity. The detail in the new XC Skies V3 updraft velocity approaches appear to be accurately showing strong lift along ranges near the bases where sun angles favor those locations.
Also coming is the ability to create your own color scales, or select ones from a predefined list of useful ranges.
More exciting features to come, including the long awaited email alerts and historical flight comparisons against forecast data for matching when large scale conditions are setting up to be similar to previous flights.
No comments:
Post a Comment